Carnegie-stage timeline
CS1–CS23 (embryonic) · PCW 9–20 (fetal) · click a stage to inspect
Click a stage to inspect; per-source coverage is shown below. Mouse equivalents are approximate. 3-D model thumbnails: HDBR Atlas, CC BY-NC-SA 4.0.
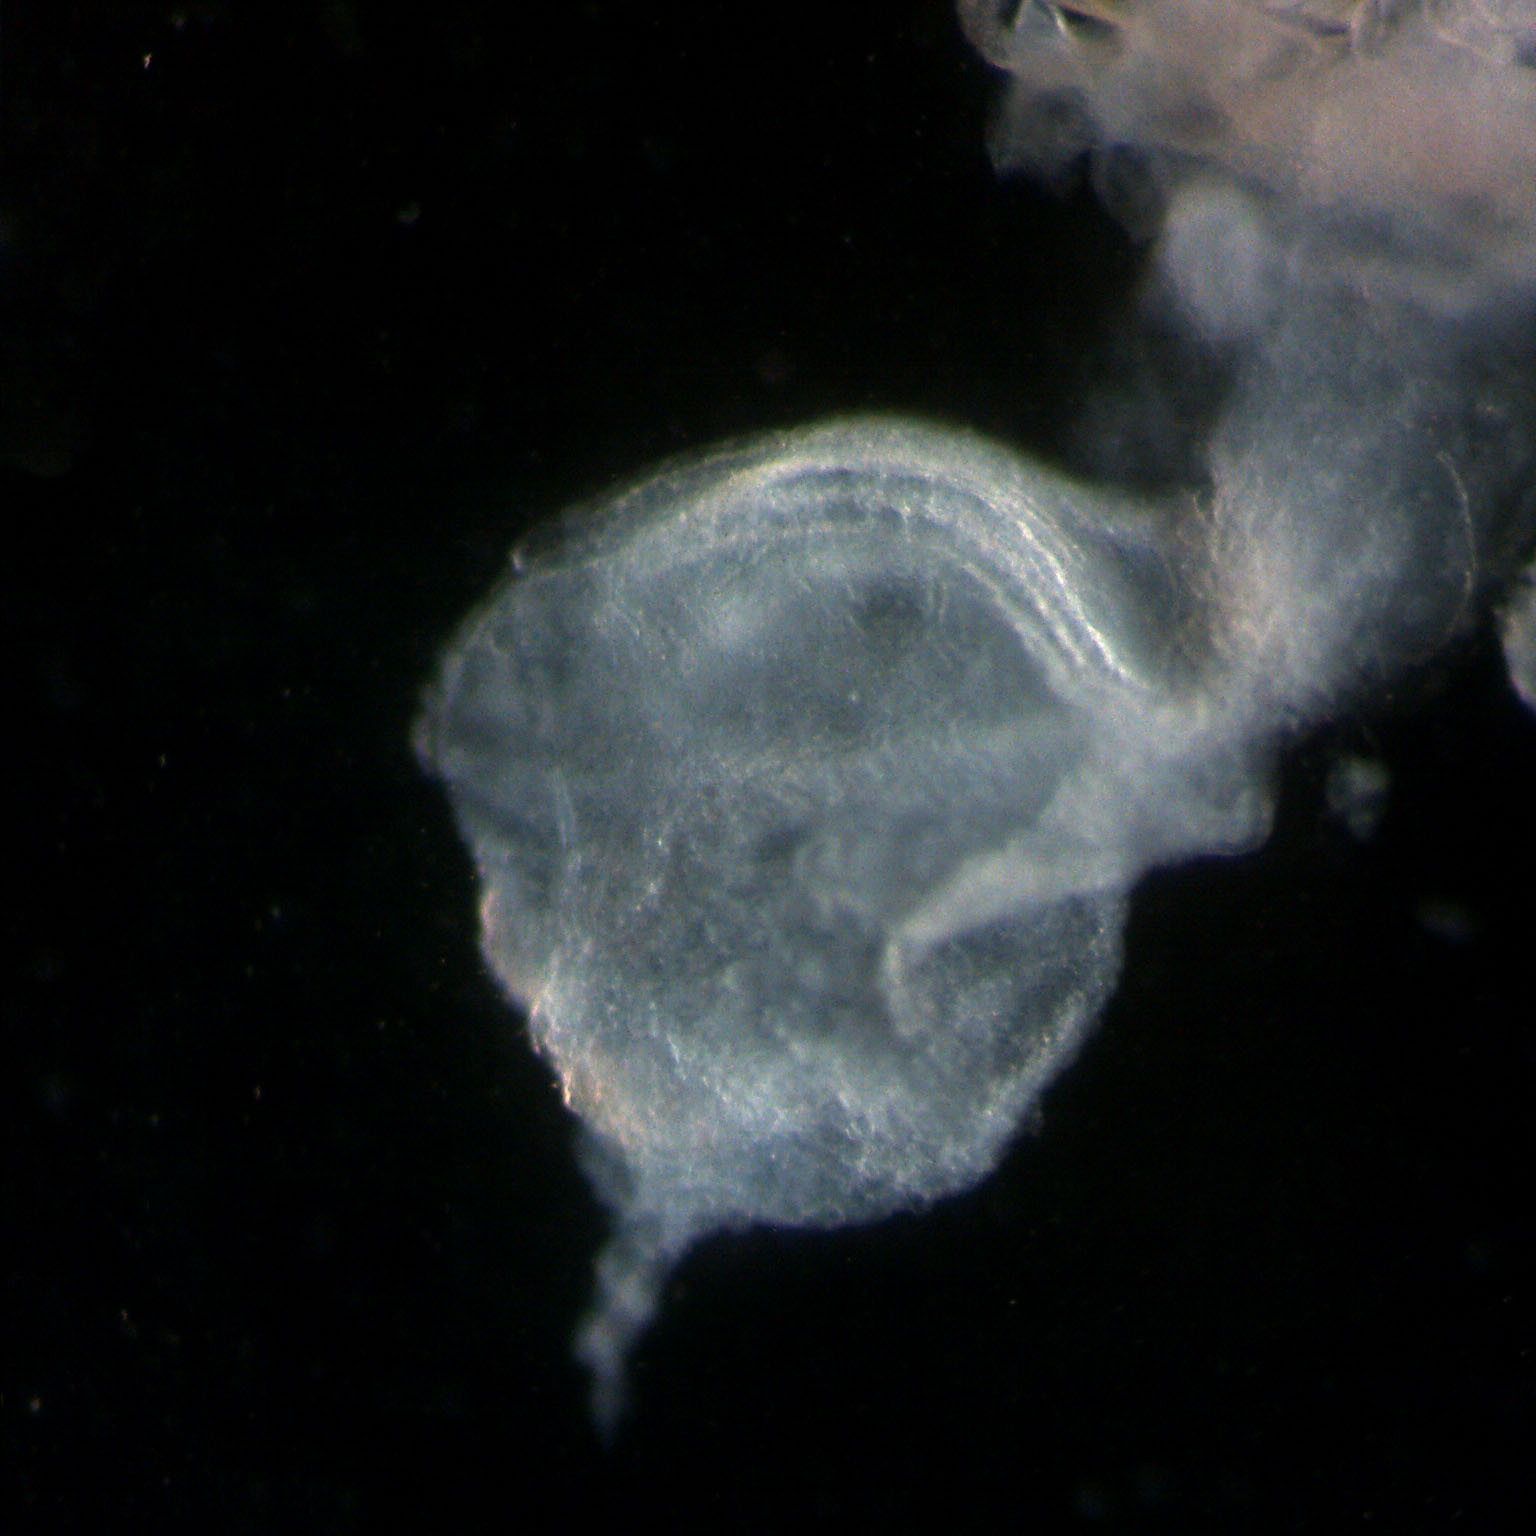
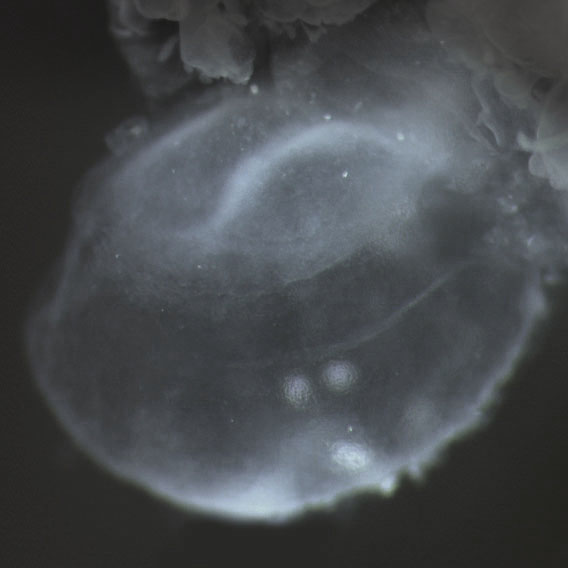
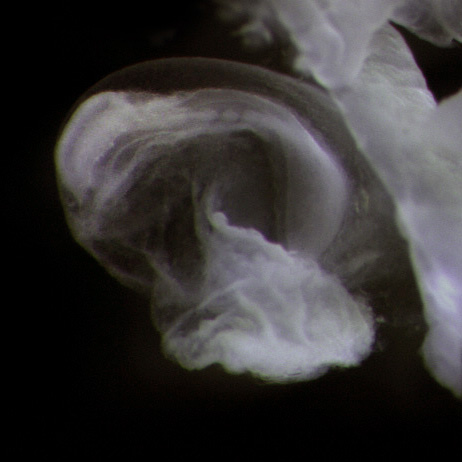
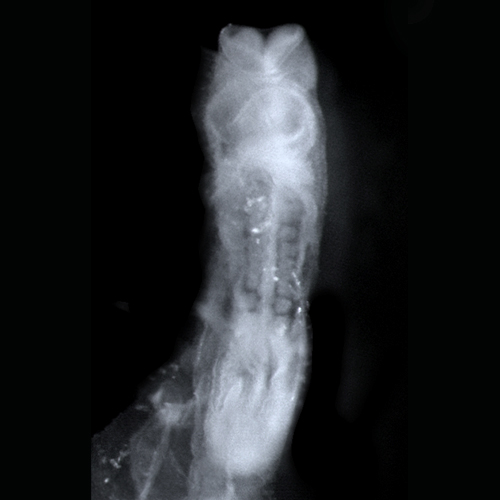
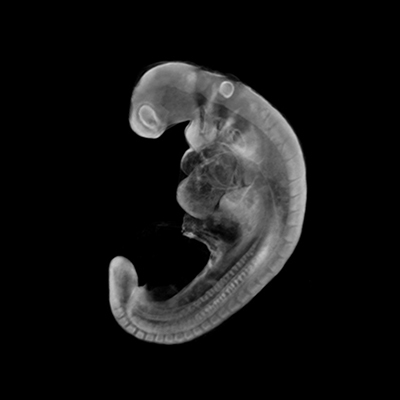
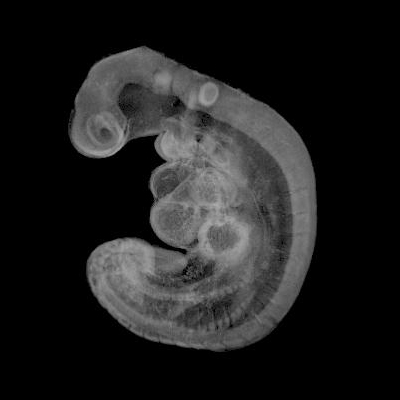
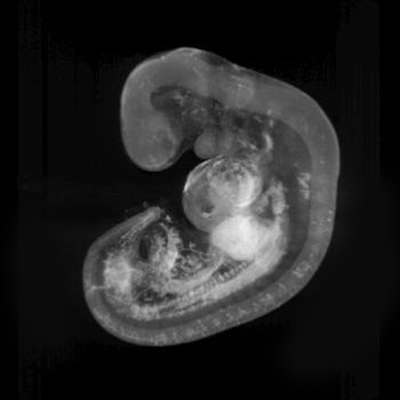
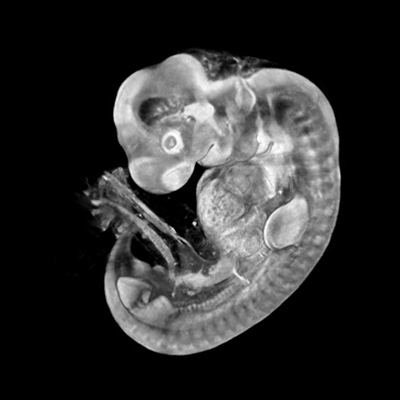
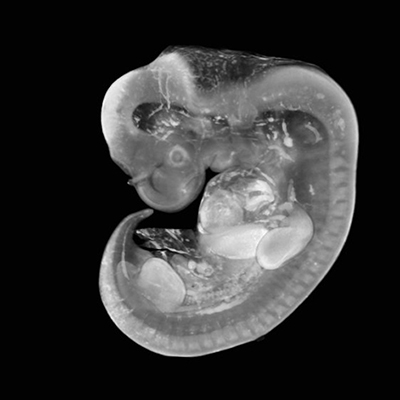
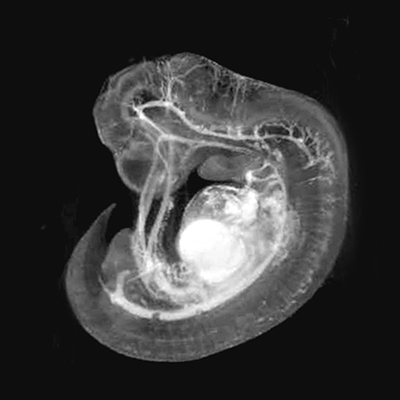
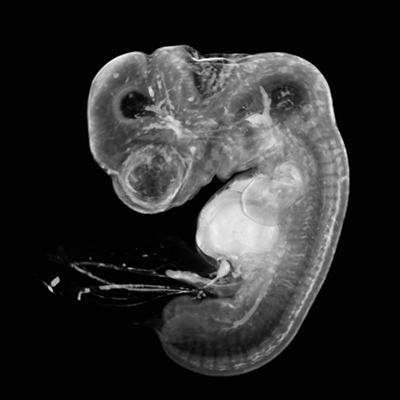
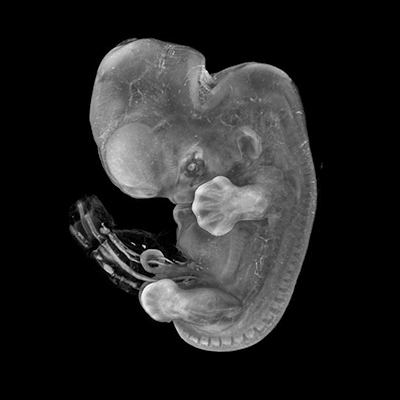
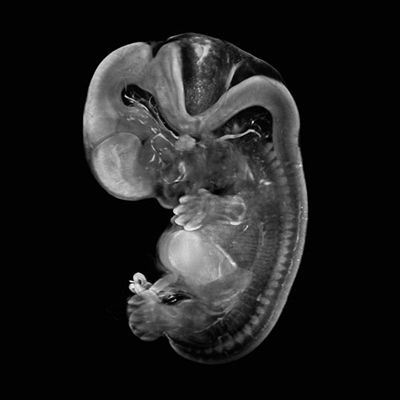
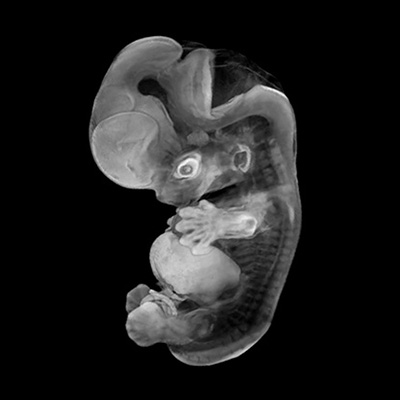
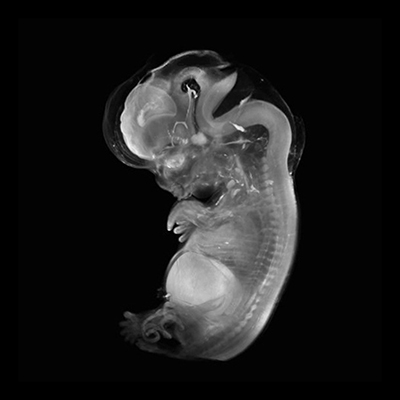
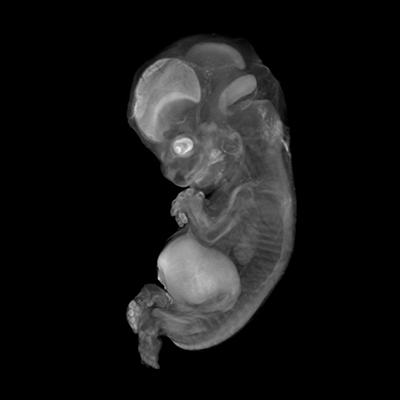
Hands and feet approach each other; fingers and toes lengthen.
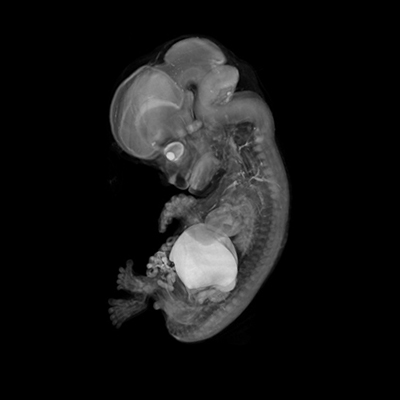
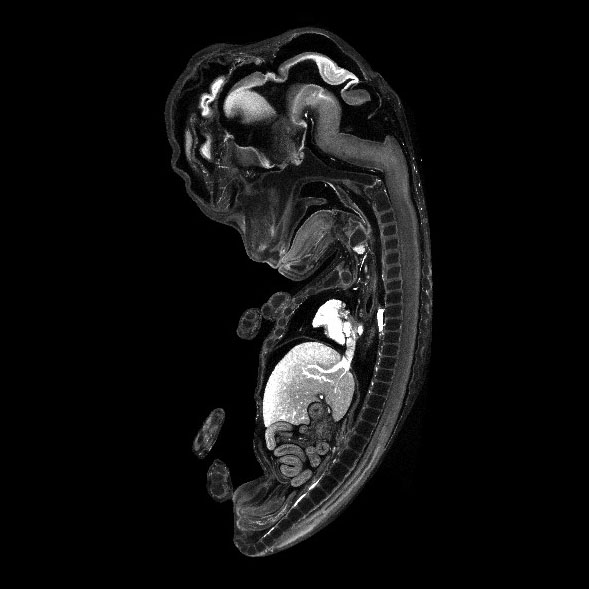
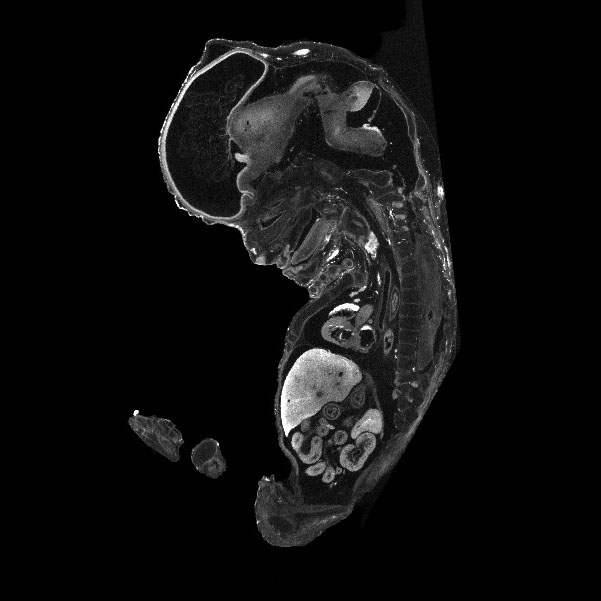
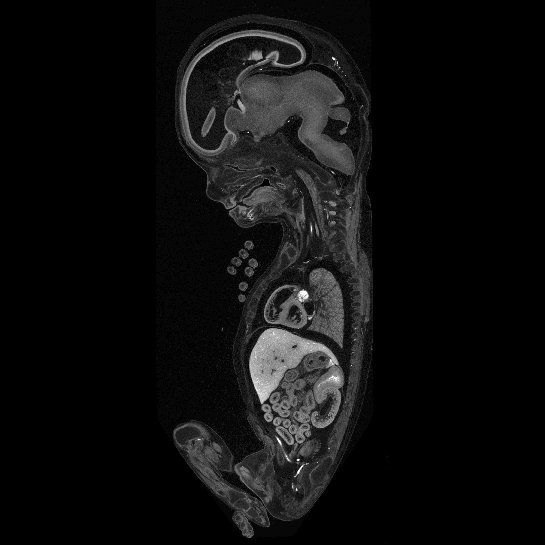
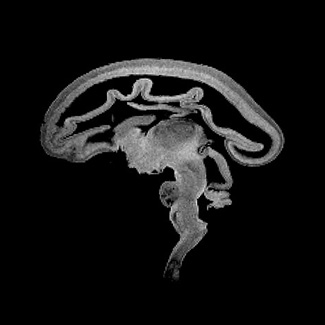
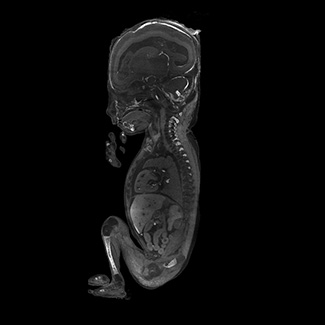
Interactive HDBR models for CS21. Click to open the viewer.
3-D models: HDBR Atlas, CC BY-NC-SA 4.0.
Stage-anchored sub-graph, as on the mouse atlas — HDBR Expression gene markers, the HESTA Stereo-seq atlas, HDBR 3-D-model anatomy, and literature-extracted claims for this stage, plus the human disease/phenotype layer (HPO + OMIM) on the shared cross-species anatomy vocabulary.
What each resource offers for CS21. These are referenced and linked out to — data is hosted by the originators; nothing is hosted on this platform yet.
Human Developmental Biology Resource (Newcastle + UCL, MRC/Wellcome). Histology, HREM 3-D, and — uniquely — an anatomy-indexed in-situ gene-expression portal. Extends into the fetal period.
de Bakker et al., Science 2016. Interactive 3-D-PDF reconstructions of every organ system across Carnegie stages 7–23, built from real serial sections.
Gasser / EHD + LSUHSC. The Carnegie Collection digitized across all 23 stages: 3,300+ labelled serial sections, 43,000+ anatomical labels. The only source covering CS1–CS6.
Status: the human layer is under construction and currently serves as a reference index — it cites and links out to external resources rather than hosting their data. Any future in-platform integration would follow a formal data-sharing agreement with each originator and preserve full attribution and licence terms (non-commercial academic use). The HDBR 3-D model thumbnails shown are used under CC BY-NC-SA 4.0 with attribution. Carnegie-to-mouse stage equivalences are approximate.