Carnegie-stage timeline
CS1–CS23 (embryonic) · PCW 9–20 (fetal) · click a stage to inspect
Click a stage to inspect; per-source coverage is shown below. Mouse equivalents are approximate. 3-D model thumbnails: HDBR Atlas, CC BY-NC-SA 4.0.
Blastocyst cavity forms. Inner cell mass and trophectoderm segregate.
Stage-anchored sub-graph, as on the mouse atlas — HDBR Expression gene markers, the HESTA Stereo-seq atlas, HDBR 3-D-model anatomy, and literature-extracted claims for this stage, plus the human disease/phenotype layer (HPO + OMIM) on the shared cross-species anatomy vocabulary.
What each resource offers for CS3. These are referenced and linked out to — data is hosted by the originators; nothing is hosted on this platform yet.
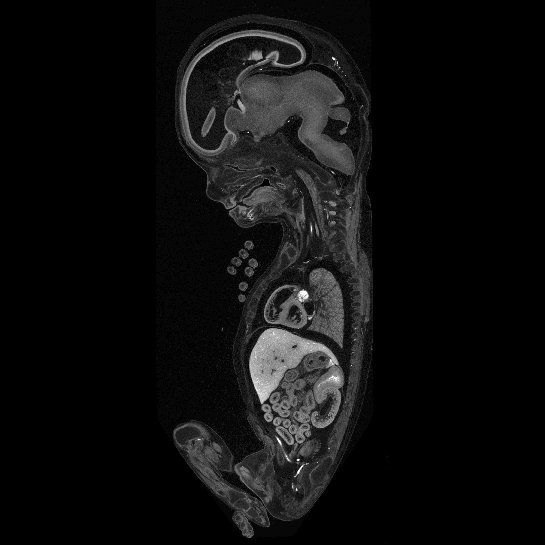
Human Developmental Biology Resource (Newcastle + UCL, MRC/Wellcome). Histology, HREM 3-D, and — uniquely — an anatomy-indexed in-situ gene-expression portal. Extends into the fetal period.
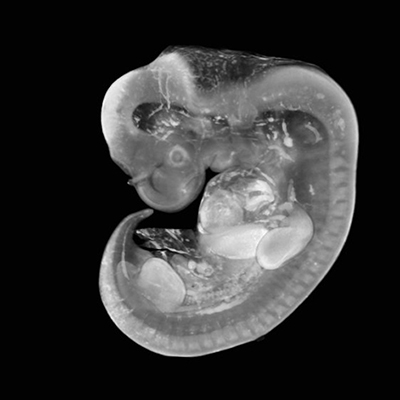
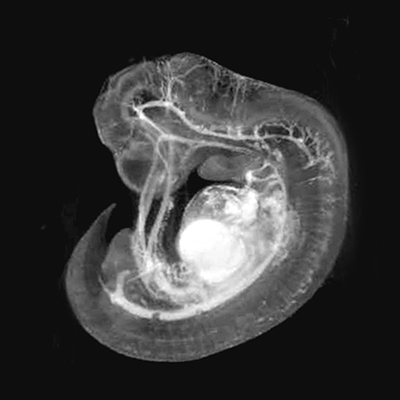
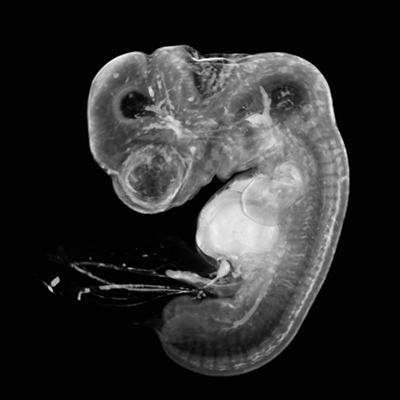
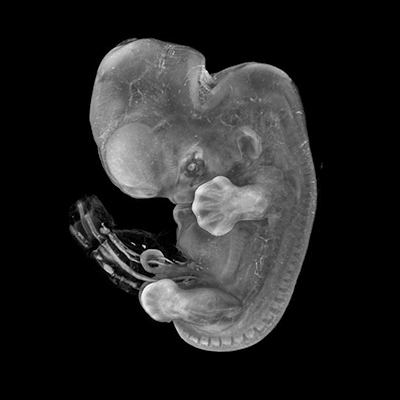
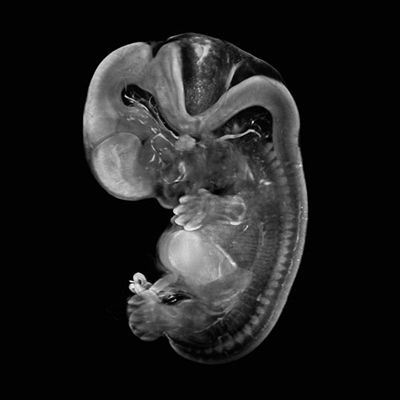
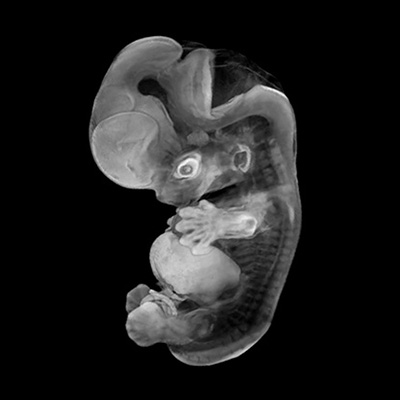
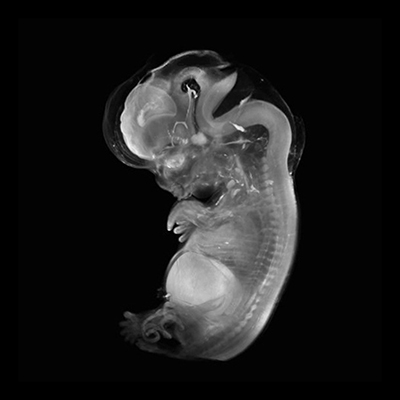
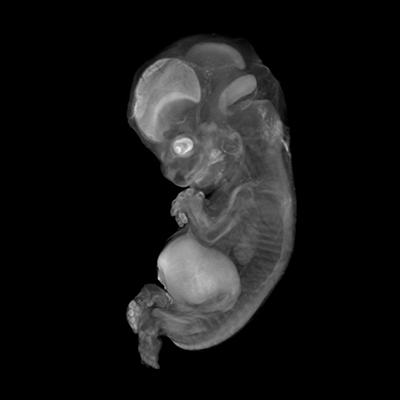
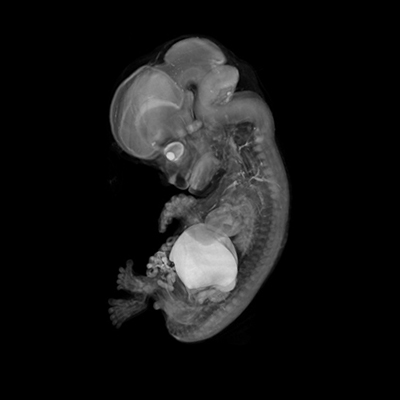
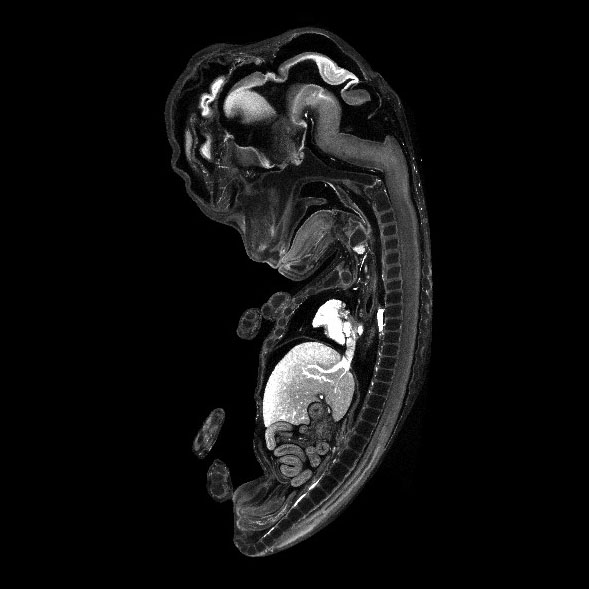
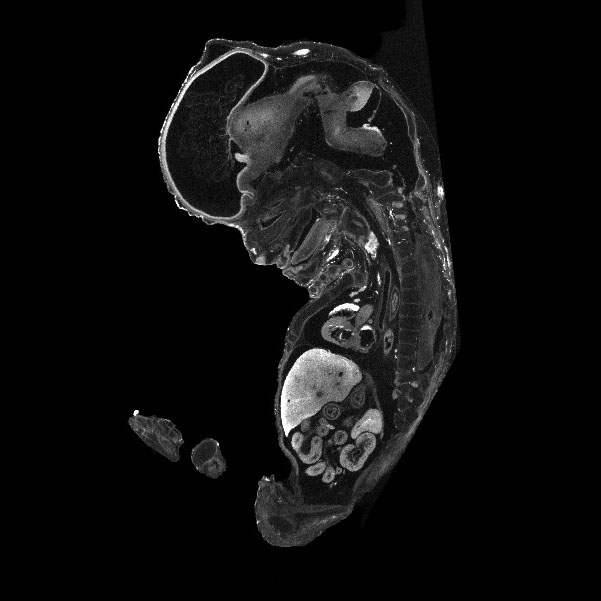
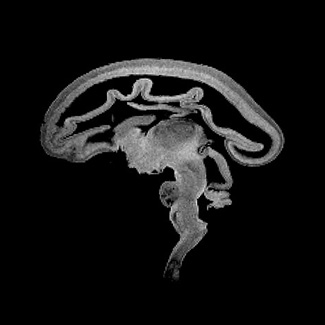
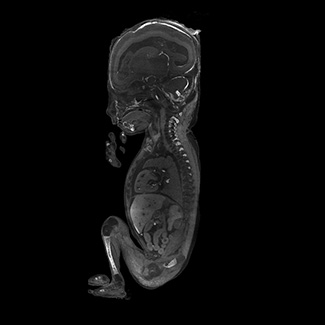
de Bakker et al., Science 2016. Interactive 3-D-PDF reconstructions of every organ system across Carnegie stages 7–23, built from real serial sections.
Gasser / EHD + LSUHSC. The Carnegie Collection digitized across all 23 stages: 3,300+ labelled serial sections, 43,000+ anatomical labels. The only source covering CS1–CS6.
The Carnegie staging system divides human embryonic development — the first ~8 weeks (56 days) post-fertilization — into 23 stages defined by morphological features rather than by size or age. Virtual Embryo aligns all imagery, anatomy, and spatial transcriptomics to this axis (extended into the fetal period by PCW).
Status: the human layer is under construction and currently serves as a reference index — it cites and links out to external resources rather than hosting their data. Any future in-platform integration would follow a formal data-sharing agreement with each originator and preserve full attribution and licence terms (non-commercial academic use). The HDBR 3-D model thumbnails shown are used under CC BY-NC-SA 4.0 with attribution. Carnegie-to-mouse stage equivalences are approximate.